An end-to-end inventory ordering system built on the Corporacion Favorita grocery dataset. It uses LightGBM quantile regression to forecast demand at a chosen service level, then allocates order quantities across SKUs subject to a hard warehouse capacity constraint.
Grocery retailers face a daily tradeoff between stockouts and overstock. Ordering too little means lost sales and unsatisfied customers. Ordering too much means spoilage, markdowns, and tied-up working capital -- particularly costly for perishable categories.
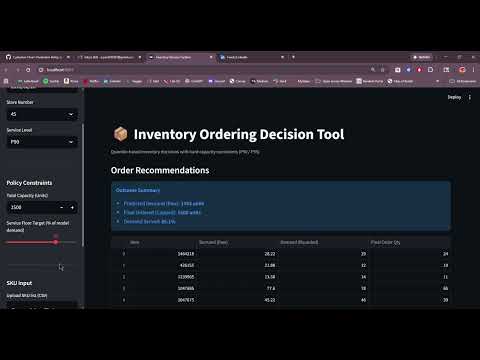
This system addresses that tradeoff directly. Rather than producing a single point forecast, it generates a quantile forecast at a chosen service level (P90 or P95), which explicitly encodes how much demand buffer the business wants to carry. The optimizer then translates those forecasts into integer order quantities that fit within the warehouse capacity available for that store on that day.
The result is a decision-ready output: not just a prediction, but an actionable order recommendation that respects both the demand signal and the operational constraint.
The Streamlit frontend sends a decision request (store, date, SKUs, capacity, service level) to the FastAPI backend. The backend slices a pre-built feature snapshot, runs LightGBM quantile inference, and passes the forecasts to the proportional allocation optimizer, which returns integer order quantities that respect the capacity cap.
Forecasting: Two LightGBM models are trained on quantile loss, one at P90 and one at P95. Features include lag sales, rolling averages, calendar signals, oil price, holiday flags, store metadata, and promotion status. Targets are log1p-transformed at training time and inverted at inference.
Optimization: Given quantile forecasts across N SKUs and a capacity cap C, the optimizer runs proportional allocation with largest-remainder rounding to produce integer order quantities. Capacity is treated as a maximum, not a target. If total forecast is below capacity, orders match forecast exactly. An optional service floor ratio guarantees a minimum allocation fraction per SKU.
Out-of-time evaluation: The API serves a 2016Q1 feature snapshot, which is outside the 2013-2015 training window, giving a realistic demonstration of model generalization.
The raw Favorita dataset contains sales records for 54 stores and over 4,000 SKUs across several years. Rather than training on the full universe, the data pipeline applies two deliberate sampling decisions to keep the dataset tractable while preserving signal from the highest-volume combinations.
Store selection: The top 25 stores by total unit sales volume are retained. This covers the bulk of revenue while avoiding noise from low-traffic locations.
Item selection: Items are kept if they have more than 500 observations in the training period and rank in the top 800 by total sales. This ensures every SKU in the model has sufficient history for lag feature construction.
Training window: Data from January 2013 through December 2015 is used for training. Lag features are computed at 7, 14, and 28 days. Rows where any lag is missing are dropped, which removes the earliest dates for each store-item pair.
Out-of-time test window: A separate 2016Q1 snapshot is built using the same store and item filters. The deployment test set starts in February 2016 rather than January to ensure all 28-day lag features are fully populated from January history. This snapshot is what the live API serves, giving a realistic demonstration of model generalization on data outside the training window.
The full data preparation process is documented in notebooks/data_preparation.ipynb.
Requirements: Python 3.11, Git LFS
Clone the repo and install dependencies:
git clone https://github.com/argonary/Inventory-Decision-System.git
cd Inventory-Decision-System
python -m venv .venv
.venv\Scripts\Activate.ps1
pip install -r requirements.txt
Download the Corporacion Favorita dataset from Kaggle and place the CSVs in data/raw/, then build the featured snapshots:
python scripts/build_training_snapshot.py
python scripts/build_featured_snapshot.py
python scripts/build_test_snapshot_2016Q1.py
python scripts/build_test_featured_snapshot_2016Q1.py
Launch the full application:
.\run_app.ps1
This opens the FastAPI backend and Streamlit frontend in separate terminals. The browser will open automatically at http://localhost:8501.
The FastAPI backend exposes three endpoints:
- GET /health -- liveness check
- GET /version -- active model version and snapshot
- POST /forecast-to-orders -- main inference endpoint
Interactive API docs are available at http://localhost:8000/docs when the server is running.
Corporacion Favorita Grocery Sales Forecasting (Kaggle). The raw data is not included in this repo. Download it from Kaggle and place the CSVs in data/raw/.
- LightGBM 4.6 -- quantile regression
- FastAPI 0.126 -- REST backend
- Streamlit 1.52 -- interactive frontend
- pandas, numpy, pyarrow -- data and feature engineering
- Plotly -- capacity curve visualization
- Git LFS -- model artifact storage