GeoLibre opens to a single workspace that is the same on desktop and in the browser. This page is a tour of that workspace so the rest of the User Guide can refer to its parts by name.
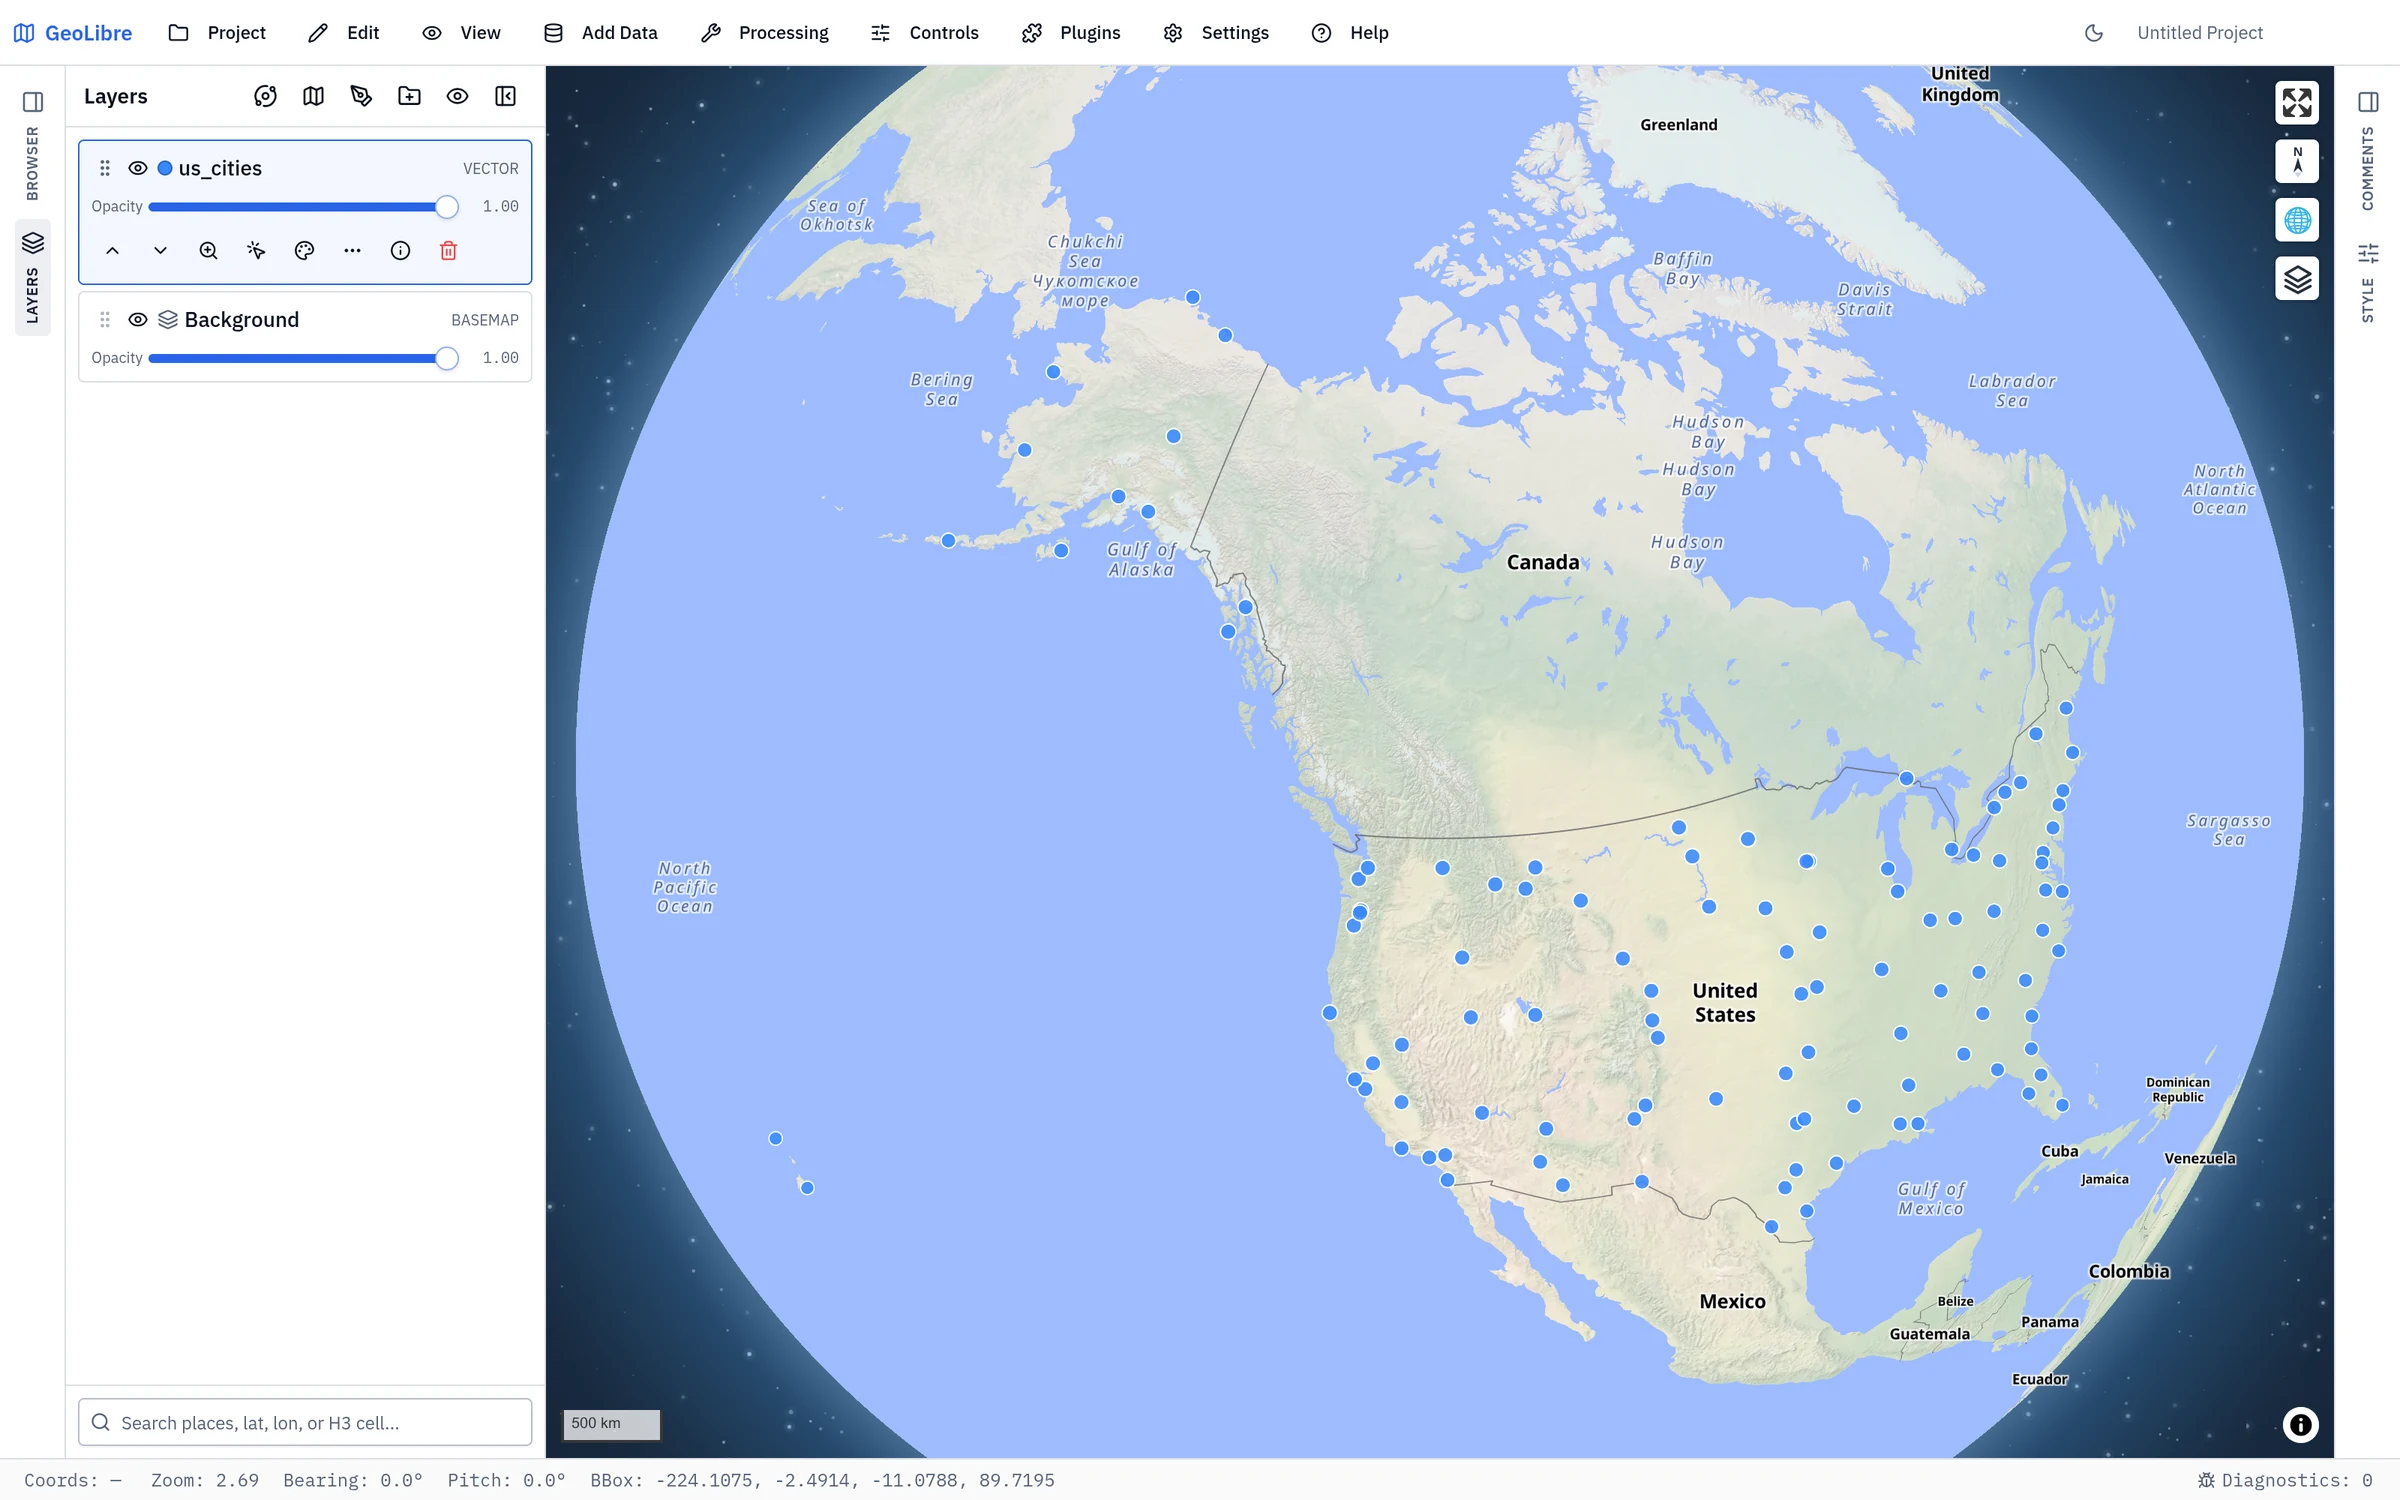
The toolbar across the top of the window groups every action into nine menus:
| Menu | What it does |
|---|---|
| Project | Create, open, save, share, import, and print projects. See Projects. |
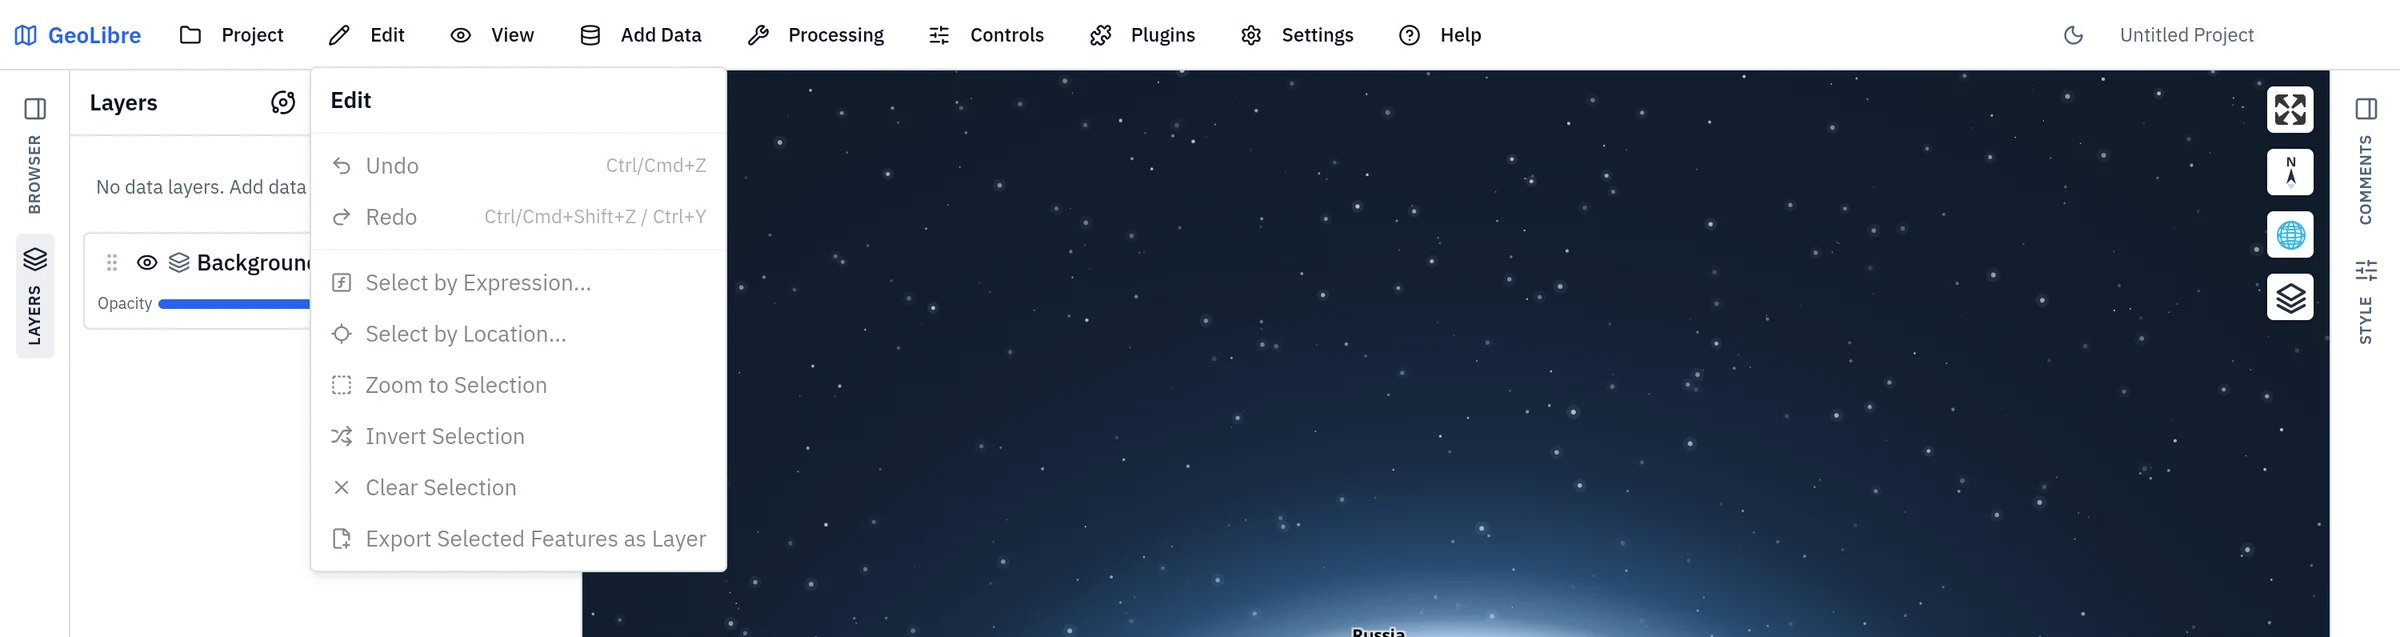
| Edit | Undo and redo, and the feature-selection tools: Select by Expression, Select by Location, zoom to / invert / clear the selection, and Export Selected Features as Layer. |
| View | Choose one of the four rendering engines, zoom in and out, step through viewport history, reset the camera orientation, set an exact view, create a split view, preview the map under color vision deficiency, or open the location in Google Maps / Google Earth. |
| Add Data | Add layers from files, web services, cloud formats, 3D data, and databases. See Adding Data. |
| Processing | Run vector, raster, conversion, Whitebox, and SQL tools, plus the AI Assistant. The menu holds two separate toolboxes, so some category names appear twice. See Processing Tools and SQL Workspace. |
| Controls | Toggle map controls and component panels (Measure, Bookmark, Minimap, and more). See Map Controls & Tools. |
| Plugins | Activate built-in plugins and set their on-map position. See Plugins & Marketplace. |
| Settings | Language, map preferences, layout, appearance, interface profile, geocoding, AI providers, environment variables, cloud storage, updates, startup project, Manage Plugins, and the Style Manager. See Settings & Preferences. |
| Help | The command palette, keyboard shortcuts, Simplify Interface..., links to the website and GitHub repository, diagnostics, feedback, update checks, and the About dialog. |
On the right side of the toolbar are the light/dark theme toggle and the editable project name.
The Edit and View menus are the two most easily missed, because their contents live nowhere else:
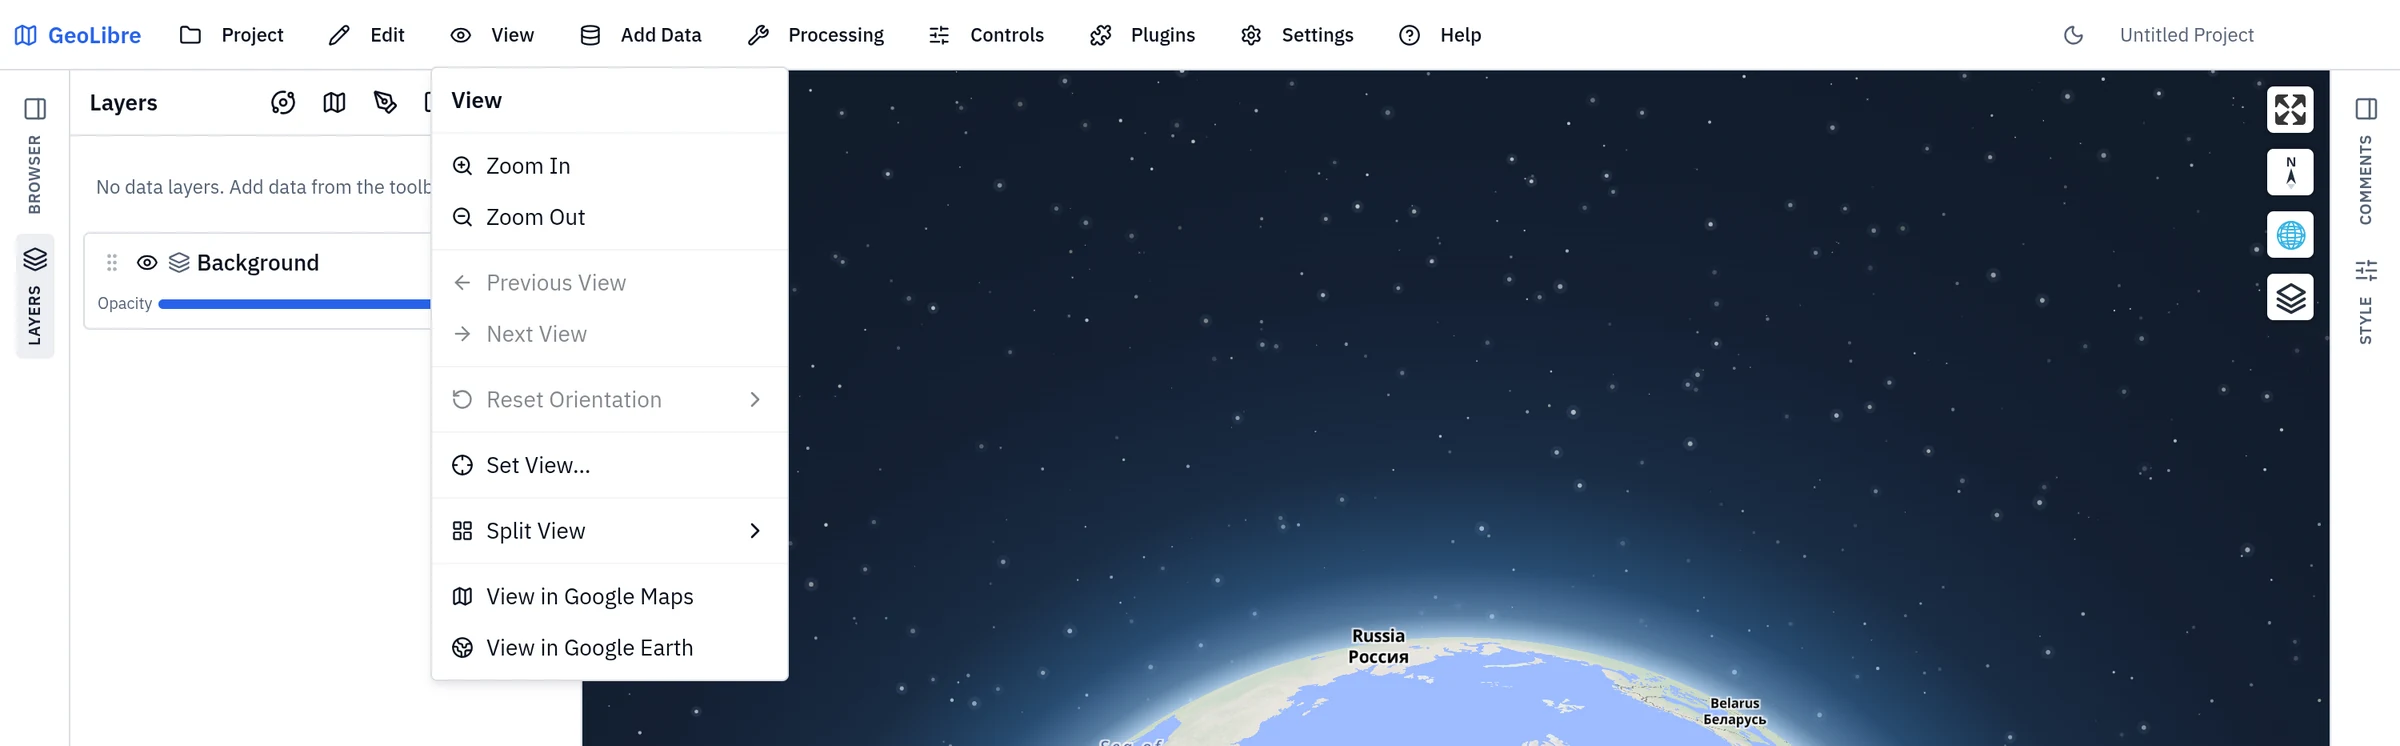
View → Color vision preview shows the map as it looks with protanopia, deuteranopia, tritanopia, or achromatopsia, so you can check that a palette still reads. It filters only the map (every renderer and split-view pane, plus the on-map legend), not the panels and menus, and shows a badge on the map while it is on; click the badge's × or pick Off to end it. The preview lasts for the session only and is not saved in the project. Exports are not affected: Print Layout, map image export, and Record Video capture the map's real colors. Only a screenshot of the window shows the simulation, which is why the badge is there.
!!! tip "Toolbar labels"
On narrow windows the toolbar collapses to icon-only buttons. You can also force icon-only buttons from Settings → Layout, or with the toolbar=icons URL parameter. See Embedding & Sharing.
Help → Simplify Interface... (also in the command palette) opens Settings → Interface, where an Experience level of Beginner, Intermediate, or Advanced trims the Add Data sources, plugins, and menu items to match, and the Data sources, Plugins, and Menus checklists hide individual items (which switches the level to Custom). Nothing is removed: switch back to Advanced, or re-tick an item, to bring it back. The command palette follows the same choice. The Help entry itself can never be hidden, so there is always a way back; it is missing only where the deployment does not offer the Settings dialog, and an administrator can lock the profile. See UI Profiles.
Every menu and toolbar action is also reachable from the keyboard, so you don't have to hunt through nested menus.
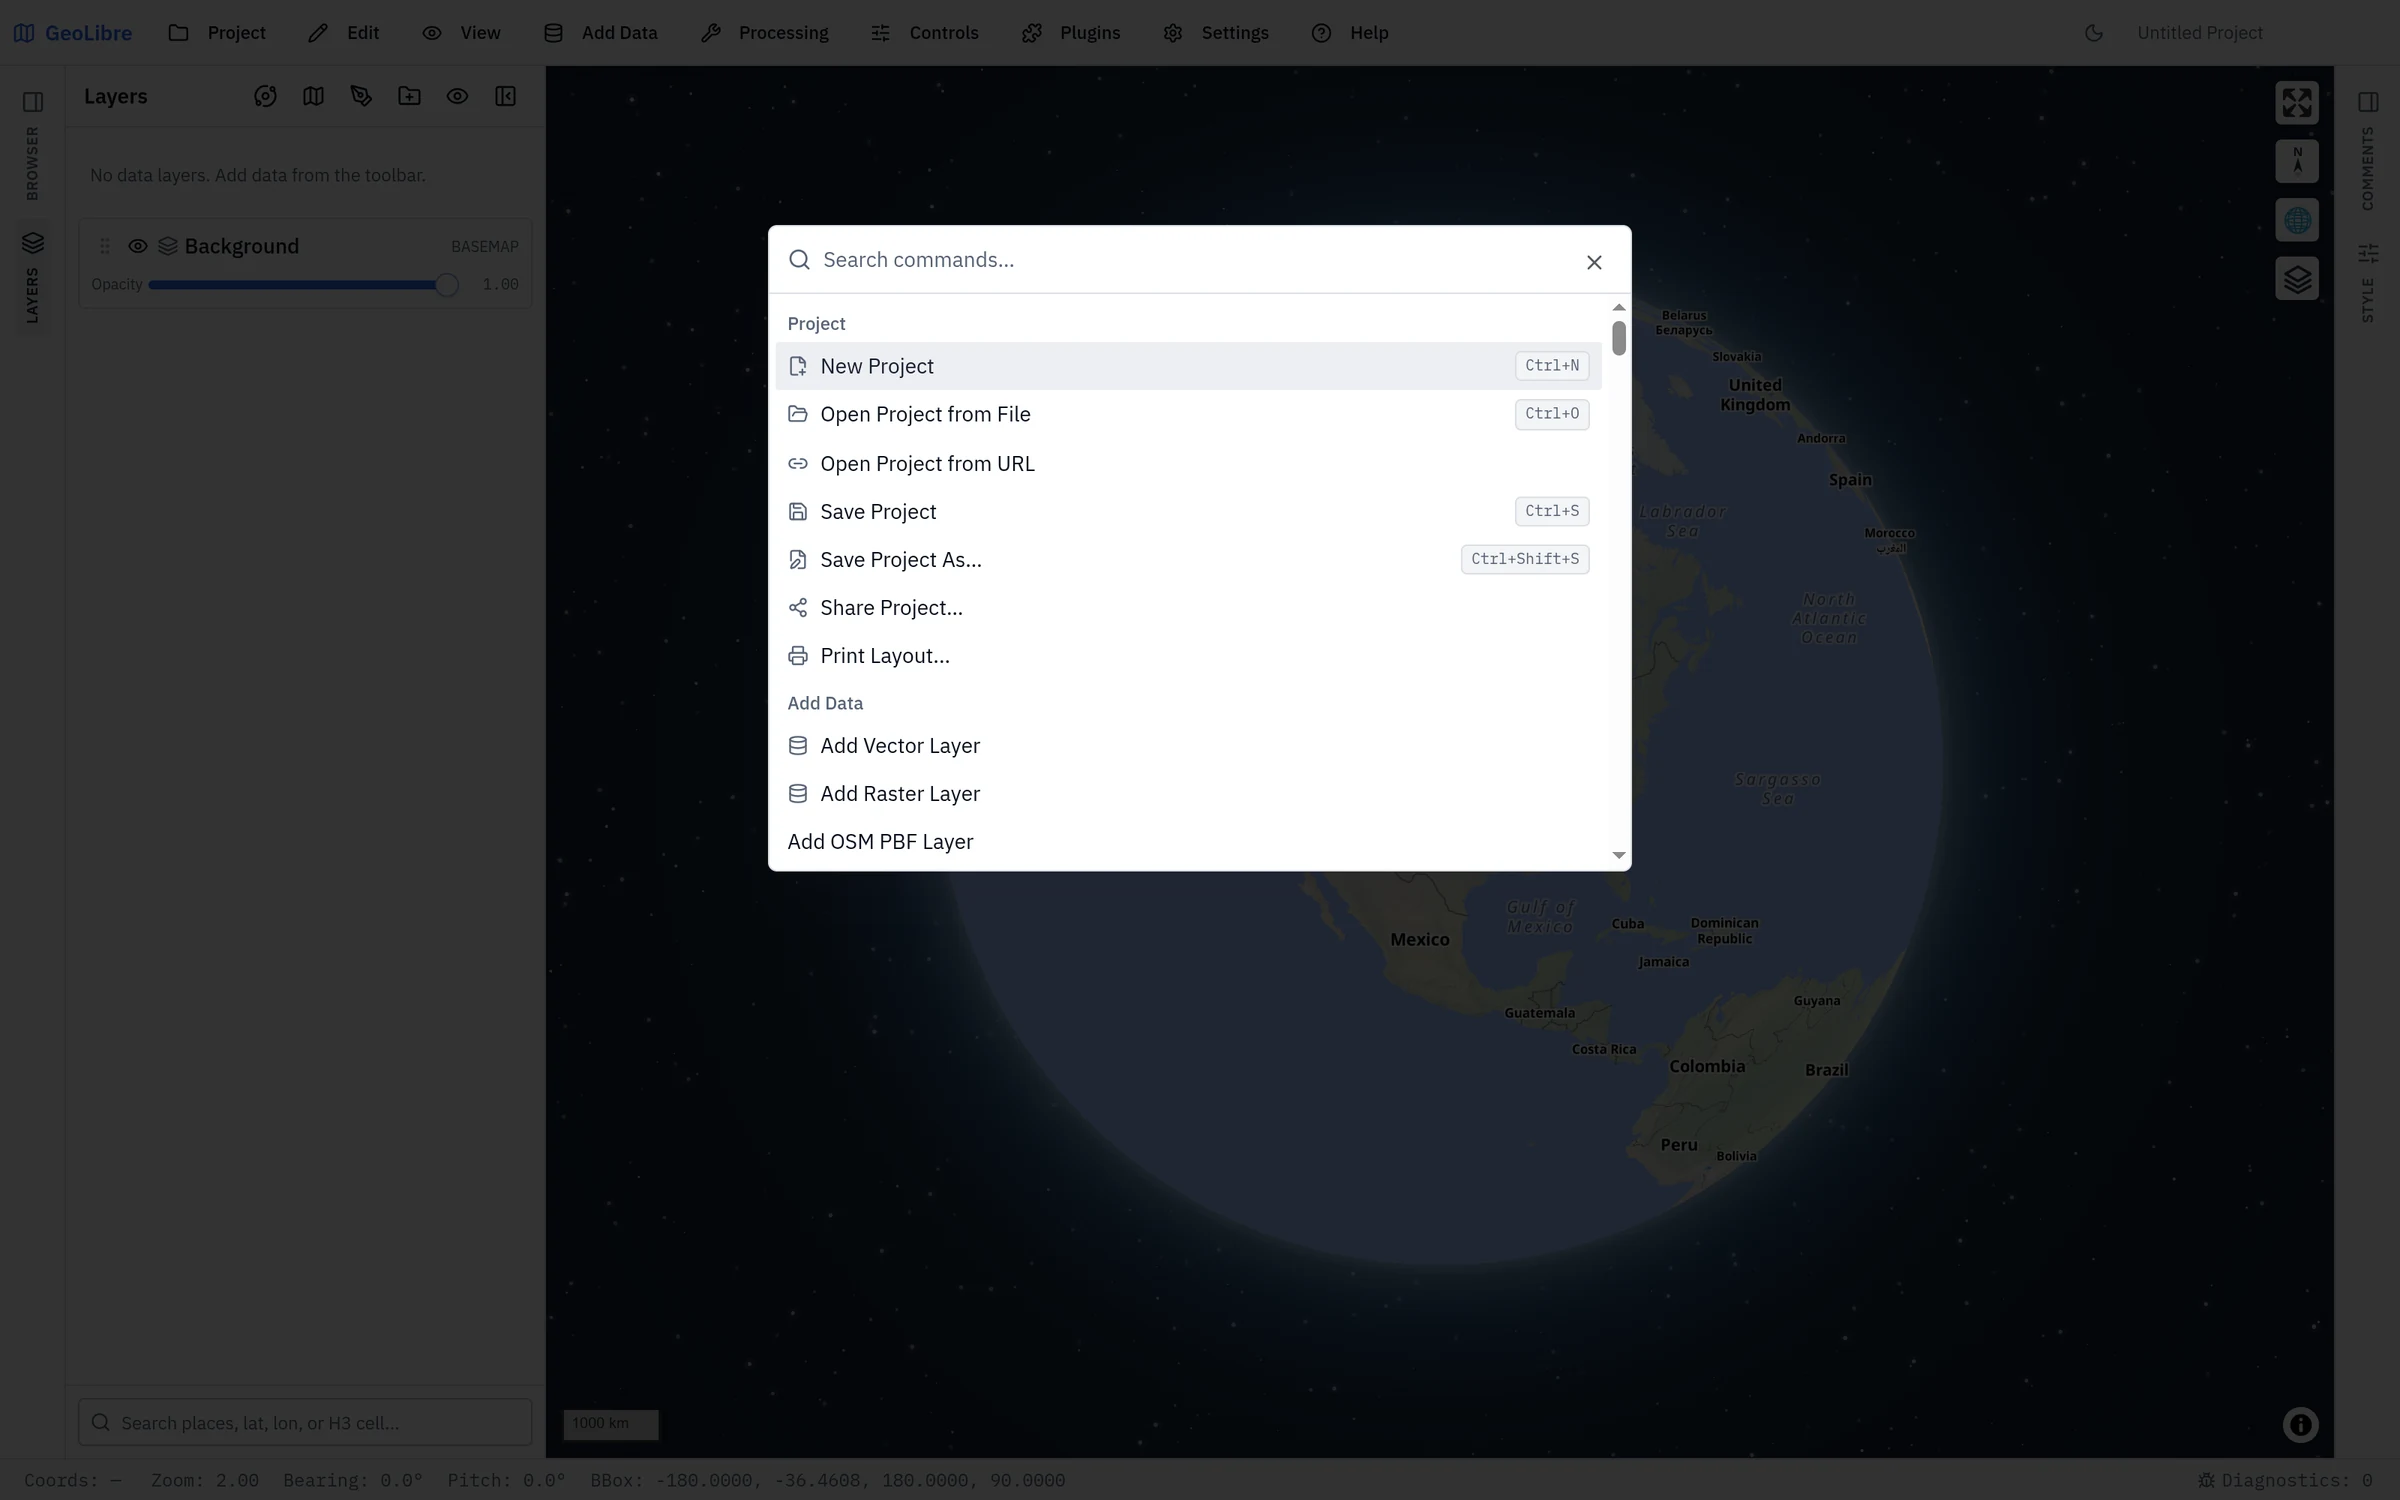
- Command palette — press
Ctrl/Cmd+K(or Help → Command Palette) to open a searchable list of actions: Add Data sources, Processing tools, Controls, Plugins, and more. Type to filter, move the highlight with the arrow keys, and pressEnterto run the highlighted command. - Individual tools — start typing and the palette also lists every processing tool on its own: the GeoLibre Toolbox vector, network, and statistics tools under Tools, and each Whitebox tool under Whitebox Toolbox. Choosing one opens the processing dialog with that tool already selected, so
Ctrl/Cmd+K, "slope",Enterreaches Whitebox's Slope without opening a menu. Tool names stay searchable in English in every language, an exact title match ranks first, and the palette hides whatever the active interface profile hides from the menus. - Keyboard shortcuts cheat sheet — press
?(or Help → Keyboard Shortcuts) to see the full list of global shortcuts.
The built-in global shortcuts are:
| Shortcut | Action |
|---|---|
Ctrl/Cmd + K |
Open the command palette |
? |
Show the keyboard shortcuts |
Ctrl/Cmd + N |
New project |
Ctrl/Cmd + O |
Open project from file |
Ctrl/Cmd + S |
Save project |
Ctrl/Cmd + Shift + S |
Save project as… |
Ctrl/Cmd + Z |
Undo |
Ctrl/Cmd + Shift + Z (or Ctrl + Y) |
Redo |
C |
Toggle the review comment tool, then click the map to place the pin |
N |
Reset bearing (north up) |
U |
Reset pitch (top-down view) |
R |
Reset pitch and bearing |
[ |
Previous view |
] |
Next view |
The single-key view shortcuts mirror Google Earth Pro (N for north up, U for top-down, R to reset the view) and work anywhere in the app.
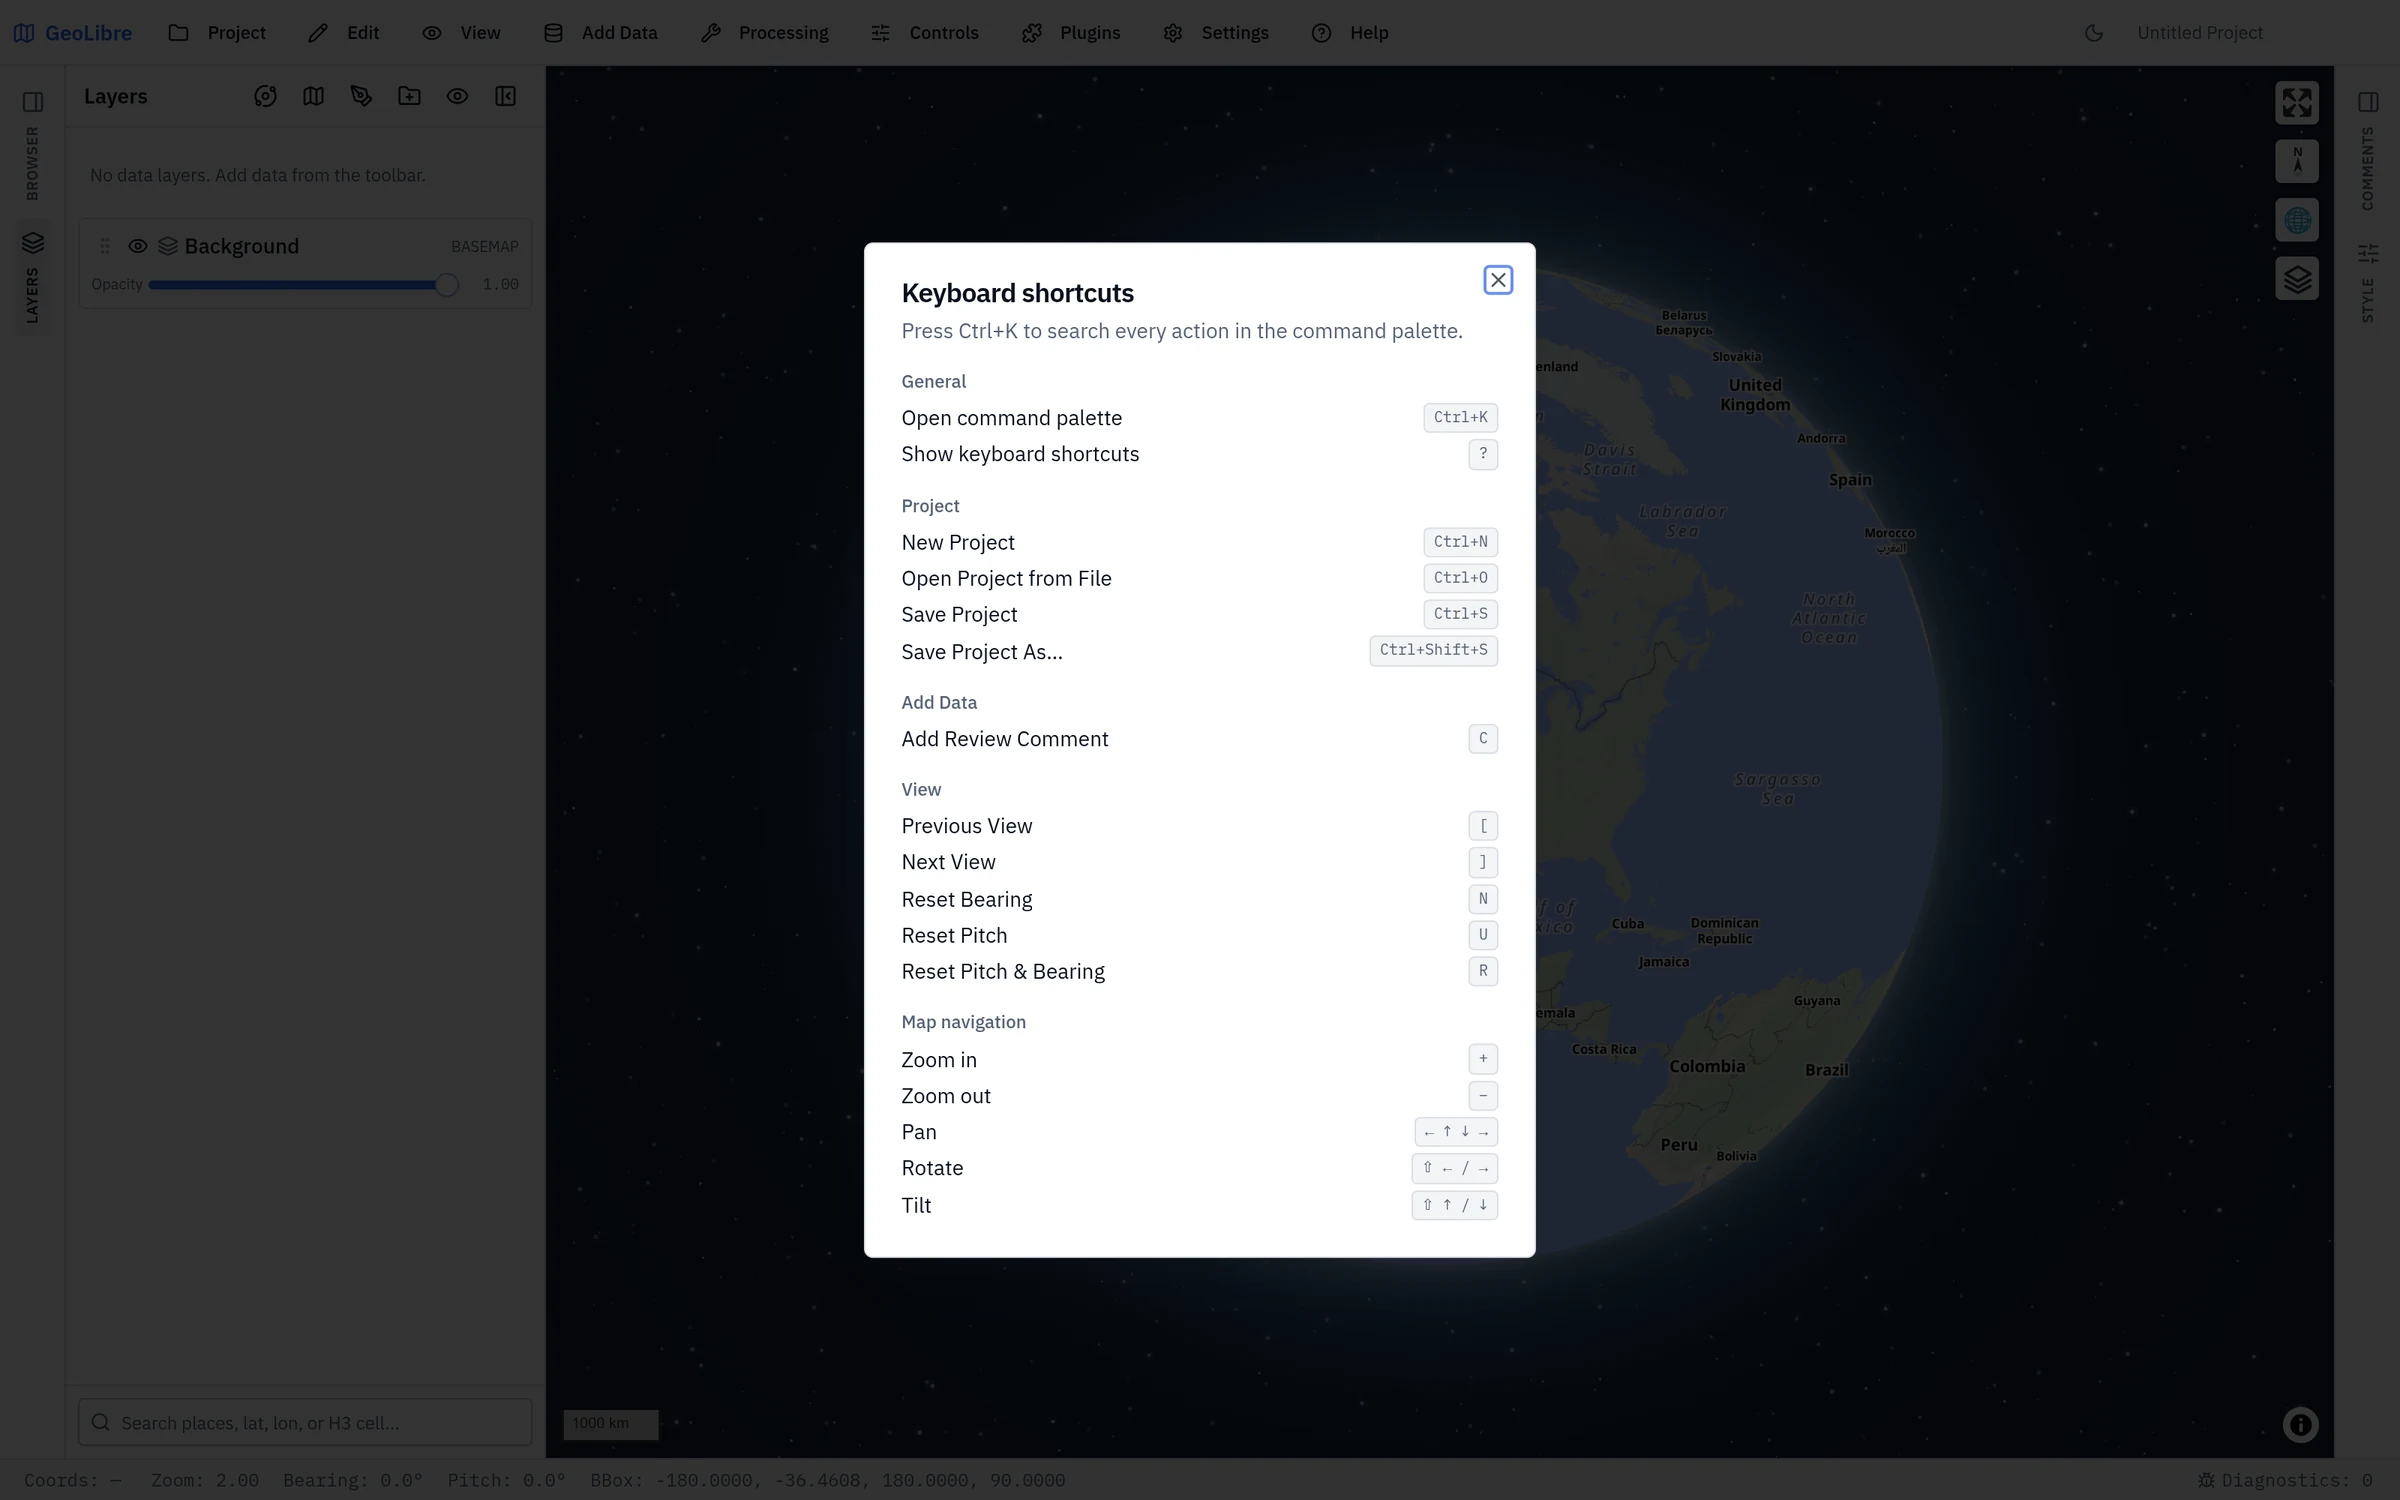
While the map has keyboard focus, MapLibre's own navigation keys are also available:
| Key | Action |
|---|---|
+ / - |
Zoom in / out |
| Arrow keys | Pan |
Shift + ← / → |
Rotate |
Shift + ↑ / ↓ |
Tilt |
Shortcuts are ignored while you are typing in a text field, so they never interfere with search boxes or attribute editing. On macOS the Cmd key is used; on Windows and Linux the Ctrl key is used.
Four dockable panels surround the map, plus the attribute table along the bottom. The left and right edges carry a vertical rail of tabs — Browser and Layers on the left, Comments and Style on the right — and clicking a tab expands that panel.
| Panel | Where | What it holds |
|---|---|---|
| Layers | Left | The layer stack, including the basemap. Toggle visibility, change opacity, reorder layers, zoom to a layer, identify features, and open per-layer actions. See Managing Layers. |
| Browser | Left | A QGIS-style Data Source Manager: saved map services, database connections, recent items, and your personal My Data layer library, all addable without going through a menu. See Adding Data. |
| Style | Right | The styling controls for the selected layer, including data-driven styling for vector layers and image adjustments for rasters. See Styling Layers. |
| Comments | Right | Anchored review notes and their threads. See Review comments. |
| Attribute table | Bottom | The attributes of the selected vector or DuckDB layer, with its own explorer, statistics, chart, and export tools. Expand it from the status bar. See Attribute Table. |
The Browser, Layers, Style, Comments, and Attribute panels can each be shown or hidden from Settings → Layout, and panels auto-hide on small screens. Resize the Layers and Style panels by dragging their inner edge, and the attribute table by dragging its top edge.
The map fills the center of the workspace. It uses MapLibre GL JS for vector and raster rendering, with deck.gl for point clouds, 3D tiles, and other advanced overlays. Pan by dragging, zoom with the scroll wheel or the on-map zoom buttons, rotate by holding the right mouse button and dragging, tilt by holding Ctrl/Cmd and dragging, and reset north with the compass button.
On-map controls such as zoom, globe, fullscreen, and the Layer Control appear in the corners. Which controls are shown is set from the Controls menu.
The status bar along the bottom reports the live state of the map, from left to right:
| Readout | Description |
|---|---|
| Coords | The coordinate under the pointer. Click it to switch notation — see below. |
| Elev | The ground elevation under the pointer. Off by default; see Elevation readout. |
| GPS | The current fix, while GPS tracking is running. |
| Zoom | The map zoom level, to two decimals. |
| Eye alt | The camera's altitude above sea level — the same quantity Google Earth Pro calls Eye alt. |
| Bearing / Pitch | The camera rotation and tilt, in degrees. |
| BBox | The bounding box of the current view (hidden on narrow windows). |
It also holds a Diagnostics: N button (also under Help → Diagnostics) that counts the errors and warnings captured this session and opens the Diagnostics dialog. It turns red when there are errors and amber when there are only warnings. While autosave is paused for a very large project, an Autosave paused notice appears here too.
Eye alt is scaled to the active celestial body, so it stays correct on a Mars or Moon basemap rather than reporting an Earth-derived height, and it follows the Scale bar units preference (metres/kilometres, feet/miles, or nautical miles). See Settings → Map Preferences.
GeoLibre can report the pointer coordinate in seven notations:
| Format | Example |
|---|---|
| Decimal degrees (default) | -83.92074, 35.96064 |
| Degrees, minutes, seconds | 35°57'38.3"N 83°55'14.66"W |
| Degrees, decimal minutes | 35°57.6384'N 83°55.2444'W |
| UTM (zone, easting/northing) | 17S 236594mE 3983527mN |
| MGRS (Military Grid Reference System) | 17SKV3659483527 |
| USNG (US National Grid) | 17S KV 36594 83527 |
| Projected (EPSG:code) | -9342014.04, 4295206.85 (EPSG:3857) |
Decimal degrees are written longitude-first, matching GeoJSON and the rest of the app; DMS and DDM lead with latitude, the way those notations are conventionally written.
Click the coordinates in the status bar to cycle through them, or set the notation in Settings → Map Preferences → Coordinate format. The choice is saved with the project.
The UTM readout uses the same projection that draws the Gridlines UTM grid. Its zone follows the same rule as MGRS, including the Norway and Svalbard exceptions (Bergen reads as zone 32V, Longyearbyen as 33X), so the UTM and MGRS readouts always name the same zone. Outside the UTM latitude band (below 80°S or above 84°N) there is no valid UTM coordinate, and the readout falls back to decimal degrees.
MGRS and USNG are the same grid reference at 1 m precision; USNG writes it with spaces. In the polar areas (below 80°S or above 84°N) the grid switches to UPS, which GeoLibre does not support, and the readout falls back to decimal degrees.
The projected format reports x/y in any coordinate reference system with an EPSG code. Choose it in Settings → Map Preferences → Coordinate format, then type a code (for example 3857 for Web Mercator or 32618 for UTM zone 18N) or pick one with Browse. The code is saved with the project alongside the format, and the readout falls back to decimal degrees for a code GeoLibre does not know or a point the projection cannot place.
The place search at the foot of the Layers panel accepts the grid notations as well as lat/lon: type an MGRS or USNG reference (18SUJ2337106519, 18S UJ 23371 06519, or a coarser 18SUJ23370651) or a UTM coordinate (18N 323394 4307395, or the readout's own 18S 323394mE 4307395mN) and pick Go to to fly there. The Paste coordinates box in View → Set View accepts the same grid references. A UTM letter is read as a latitude band, so S means band S (32°N–40°N) when the northing fits it and the southern hemisphere otherwise.
Controls → Elevation turns on the Elev readout. It is off by default, and it resolves the height under the pointer from one of two sources:
- From the map's own 3D terrain, whenever a usable sample is available there. This is instant, tracks the cursor live, and sends nothing off your device.
- From the public Open-Meteo elevation API when terrain returns no value for that point — because 3D terrain is off, but also when it is on and the terrain has no sample to give. The lookup waits until the pointer has been still for half a second, caches results per roughly 11 m cell, and runs only on Earth, never on a planetary basemap.
Because that fallback sends the coordinates under your pointer to a third-party service, GeoLibre asks for consent the first time you enable the readout. Declining is what guarantees the readout never reaches the network — turning 3D terrain on makes the remote lookup rare, but does not by itself rule it out. Decline and the readout still works wherever terrain can answer. While a lookup is in flight the readout is blank rather than showing the previous point's height.
!!! tip "Reading elevation along a line" For a profile rather than a single point, use the Elevation Profile plugin, or the Measure tool, which reports terrain-aware 3D distances.
Messages about what just happened (a layer that failed to load, a file that was skipped, a plugin that could not start) appear as notifications stacked in the bottom corner of the window, above the status bar:
- Success and information messages close themselves after a few seconds, and warnings after a little longer. Hovering over or focusing a notification pauses the timer.
- Errors stay until you dismiss them with × or
Esc, and are also recorded in the Diagnostics dialog. - A message that repeats collapses into one notification with a counter such as ×3, and at most four show at once.
- Error notifications carry a Report issue button. See Reporting a problem.
Use the sun/moon button on the toolbar to switch between light and dark themes, and Settings → Appearance to pick an accent color. The theme follows your operating system preference by default, and you can set it for embeds with the theme=dark or theme=light URL parameter. See Embedding & Sharing.
The same UI runs as an installed desktop app (built with Tauri) and as a web app in the browser. The browser build covers most workflows, but features that need direct access to the local filesystem (native file dialogs, local MBTiles and raster reads, reopening referenced local files, and the Python sidecar tools, unless a self-hosted web deployment proxies the sidecar) require the desktop app. In the browser, projects open through the browser's file picker and save through its save dialog or as a download. Each affected page notes these differences. See Getting Started for installation and Downloads for installers.