A correlation matrix is a table that shows the correlation coefficients between multiple variables. Each cell in the table represents the correlation coefficient between two variables. A correlation coefficient is a statistical measure that indicates the extent to which two variables are related to each other.
A correlation matrix tells us several things:
Strength of the relationship: The correlation coefficient ranges from -1 to 1, with values closer to -1 or 1 indicating a stronger relationship between two variables. A value of 0 indicates no relationship.
Direction of the relationship: A positive correlation coefficient indicates that two variables tend to increase or decrease together, while a negative correlation coefficient indicates that they tend to move in opposite directions.
Patterns among multiple variables: By examining the entire correlation matrix, we can identify patterns among multiple variables. For example, we may find that several variables are strongly correlated with each other, while others are not related at all.
Potential for prediction: If two variables are strongly correlated, we may be able to use one variable to predict the other. This can be useful in fields such as finance, where analysts try to predict future stock prices based on past performance.
Overall, a correlation matrix is a useful tool for understanding the relationships among multiple variables and identifying patterns in large datasets.
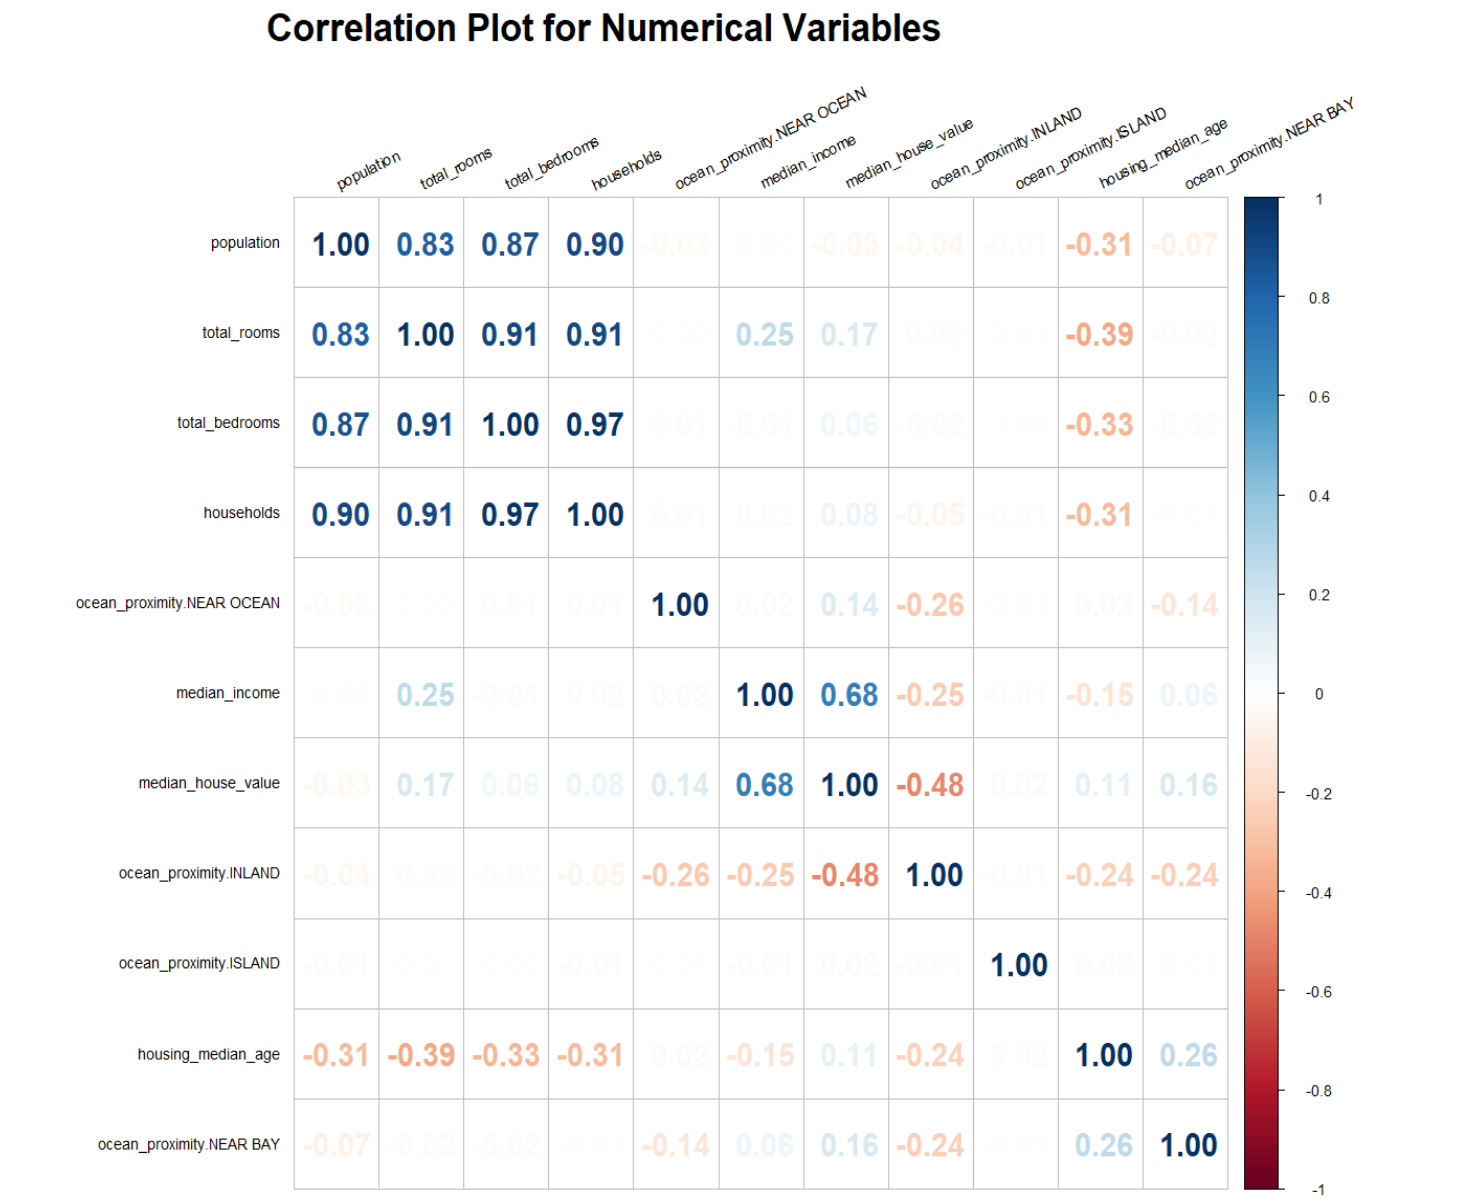
A correlation matrix is a table that shows the correlation coefficients between multiple variables. Each cell in the table represents the correlation coefficient between two variables. A correlation coefficient is a statistical measure that indicates the extent to which two variables are related to each other.
A correlation matrix tells us several things:
Strength of the relationship: The correlation coefficient ranges from -1 to 1, with values closer to -1 or 1 indicating a stronger relationship between two variables. A value of 0 indicates no relationship.
Direction of the relationship: A positive correlation coefficient indicates that two variables tend to increase or decrease together, while a negative correlation coefficient indicates that they tend to move in opposite directions.
Patterns among multiple variables: By examining the entire correlation matrix, we can identify patterns among multiple variables. For example, we may find that several variables are strongly correlated with each other, while others are not related at all.
Potential for prediction: If two variables are strongly correlated, we may be able to use one variable to predict the other. This can be useful in fields such as finance, where analysts try to predict future stock prices based on past performance.
Overall, a correlation matrix is a useful tool for understanding the relationships among multiple variables and identifying patterns in large datasets.